Batumi Property Prices: 3-Year Trend and 3-Year Forecast
How new-build prices in Batumi moved in 2023-2025 and what comes next, per Galt and Taggart and TBC Capital. District breakdown.
Batumi property prices over the past three years have followed a path that is easy to misread. Look only at developer headlines and the market seems to climb forever; look only at the worried talk of oversupply, and it seems about to collapse. The truth is calmer and more useful than either extreme, and this article lays out a year-by-year price series, a district map, and an honest forecast. Each figure is accompanied by its source and period, so you can verify them yourself.
What drove the market in 2022-2025
Batumi's price growth in recent years is not a speculative bubble; it reflects real demand. After 2022, a wave of migration and capital reached the region, and the coast gained several supporters at once. The first is the foreign buyer: Batumi is a genuinely international market, with roughly 52% of 2025 transactions made by foreigners, and the fastest-growing segment is Israel at around 13% of all deals (Galt and Taggart, full-year 2025). The second is seaside tourism and rentals, which feed yields and sustain demand for investment apartments. The third is large-scale construction involving major international players, which re-rates entire districts as projects come on stream.
Together, these forces produced steady price-per-meter growth for several years running, resting on concrete construction, tourist flows, and recorded transactions rather than on expectation alone. The same dynamic explains why the market enters a calmer phase in 2026: supply has accumulated, and from here it is not any purchase that wins, but the right one.
New-build price trend over three years
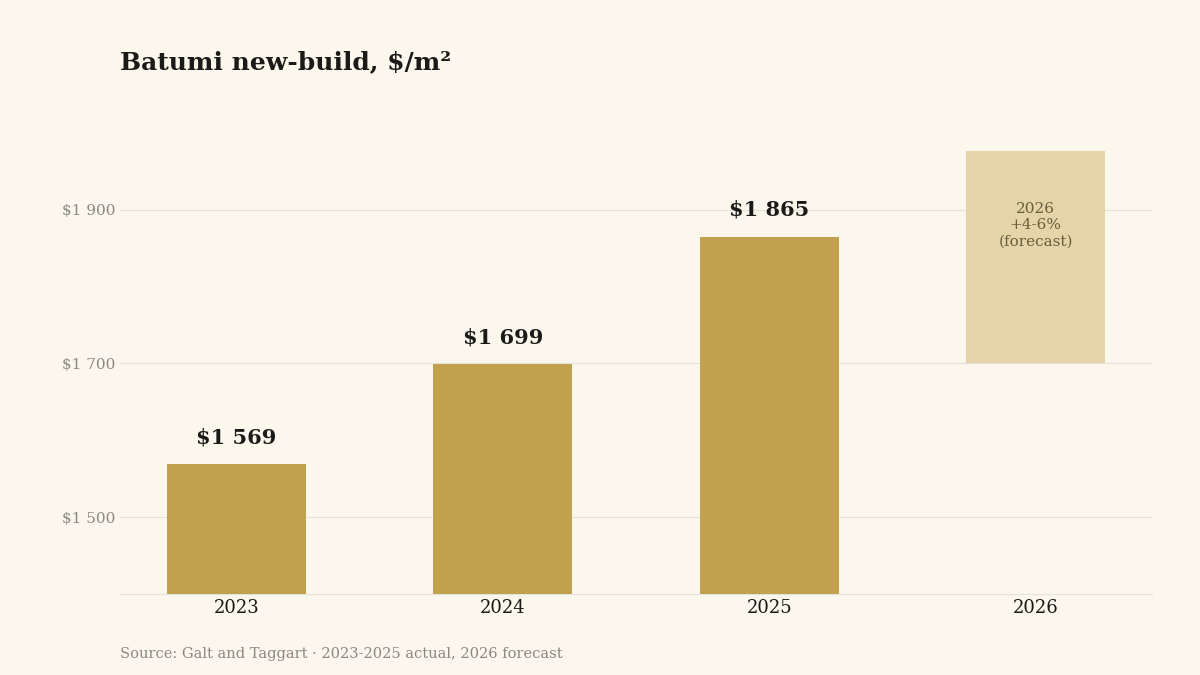
Here is the core series the whole article turns on: the average price per square meter of a new-build apartment in turnkey condition, that is, with finished fit-out, per the research arm of Galt and Taggart:
- 2023: about USD 1,569 per sqm
- 2024: about USD 1,699 per sqm (up roughly 8.3% year on year)
- 2025: about USD 1,865 per sqm, up 9.4% year on year (Galt and Taggart, via Investor.ge, April 2026)
Across the three years from 2022 to 2025, Batumi new-build prices added on the order of 40%, roughly 12% a year. This is the period people mean when they cite "growth of up to 40%," and the framing matters: it is history, a fact of the past three years, not a promise about the future. Below, we show why the 2026 forecast is distinctly more modest, a normal sign of a maturing market rather than a cause for alarm.
Why do you see different prices per meter?
Compare a few sources, and you will find a discrepancy that confuses buyers. Galt and Taggart puts turnkey new-build at about USD 1,865 per sqm for 2025; TBC Capital puts the average across Batumi at about USD 1,395 per sqm, up around 17% year on year (TBC Capital, slide deck, February 2026). That is nearly a third apart. Who is right?
Both are, because they measure different things. These are two different samples:
- USD 1,865 is the average for new-builds in finished condition (turnkey primary). This is the figure that matters when you buy a new apartment from a developer.
- USD 1,395 is the average across the entire market: primary, secondary, and unfinished units alike. The resale stock and shell units pull the average down, so the all-market figure is lower.
This difference matters: it removes the false impression that someone is misleading you about the price, and it sets the right anchor. When buying new-build, compare against the turnkey primary series, not the all-market average, or your budget will be set too low. When we prepare numbers on a property, we always separate comparable new-builds from the market as a whole.
Prices by district: from the periphery to Old Batumi
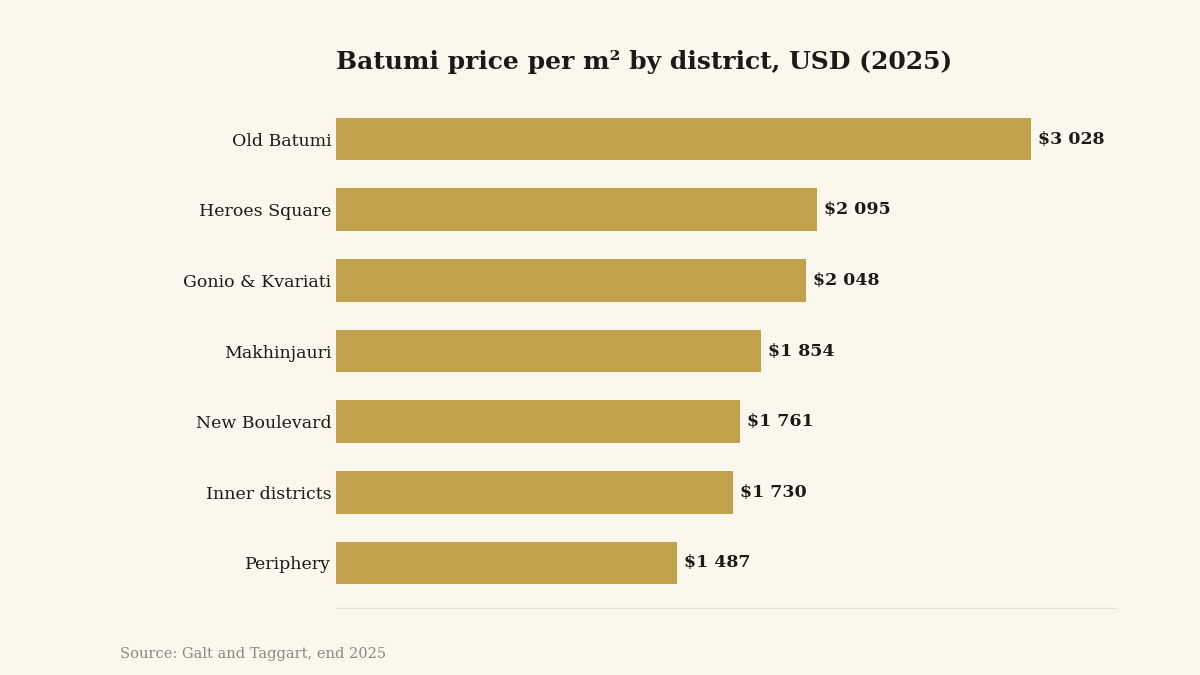
The citywide average hides a wide spread. Within Batumi, the price per meter roughly doubles depending on the district. Here is the picture for a turnkey new-build at the end of 2025 (Galt and Taggart):
| District | Price per m2, USD (approx.) |
|---|---|
| Old Batumi | 3,028 |
| Heroes Alley | 2,095 |
| Gonio and Kvariati | 2,048 |
| Makhinjauri | 1,854 |
| New Boulevard | 1,761 |
| Inner districts | 1,730 |
| Periphery | 1,487 |
A few takeaways. Prime Old Batumi, the historic seaside center, costs twice the periphery: you pay for location and views. Yet most transaction volume sits not in the most expensive segment but on New Boulevard and Heroes Alley, the working middle with a balance of price and liquidity. Gonio and Kvariati, the coastal zone south of the city, already hold above USD 2,000 per sqm and deserve study on their own: part of the large-scale construction re-rating the location sits here. The periphery, at about USD 1,487, is the lowest entry price per meter, but its liquidity and rental potential should be judged soberly, not by price alone.
Price per meter is only half the equation. The other half is what that money returns in yield and resale, and that depends heavily on district and format. So we always tie the choice of district to your goal: capital growth, rental income, or a home for yourself.
Who drives demand
Who buys tells you how durable prices are. Demand in Batumi is half external: about 52% of 2025 transactions were foreign (Galt and Taggart, full-year 2025). Within that share, Israel leads at around 13% of all deals and is the fastest-growing segment; EU buyers account for around 14%, with Ukraine, Belarus, and other post-Soviet countries at around 11% combined. The market does not hang on a single source: if one segment cools, others support volume.
Analysts name buyer diversification explicitly as the key factor for 2026: how quickly the market absorbs new supply and how resilient foreign demand proves will determine whether it stabilizes or stumbles (Galt and Taggart, 2025 review and 2026 outlook). Price from here depends on the balance of demand and new completions, not on momentum.
The 2026 forecast: a year of consolidation
This is the most useful part, and we will name the uncomfortable point plainly. New-build price growth in Batumi is slowing in 2026: Galt and Taggart forecasts about 4-6% for the year, down from 9.4% in 2025 (Galt and Taggart, 2025 review and 2026 outlook). Primary sales, on the same forecast, are expected to stay broadly flat. The analysts themselves call 2026 "a year of consolidation, not expansion."
The cause is not weak demand but a supply overhang. Unsold inventory in Batumi rose about 14% year on year to around 12,400 apartments by the end of 2025, while projects scheduled for 2025-2029 hold on the order of 58,000 units, of which about 80% target short-term rental (Galt and Taggart). In plain terms, building is outpacing absorption, and primary prices rose faster than secondary prices (9.4% versus 6.9% in 2025), widening the gap between them. When supply outpaces demand, the pace of price growth naturally cools.
Now the turn, which is factual rather than consoling. A slowdown to 4-6% is still growth, not a decline, and it follows three strong years. A supply overhang is not a crash; it means the market is maturing, moving from a stage where everything rises to one where what is chosen well rises. For a buyer, this changes not whether to enter, but what to enter. With an abundant supply, the cost of a wrong district or format is higher, and so is the value of a curated selection that filters out illiquid and overpriced units. A large pipeline is not a reason to avoid buying; it is a reason to buy deliberately. That is exactly what we take on: vetting the developer, selecting liquid locations, and running sober numbers on the property.
The 2027-2028 horizon: where we honestly say "no data"
Beyond 2026, authoritative sources give no precise numeric price forecast for Batumi, and we will not invent one. Any "precise" growth figure quoted to you for 2027 or 2028 is conjecture, not analysis. What can be said honestly is qualitative.
Construction costs act as a floor under prices: materials and labor are not getting cheaper, so selling new-builds well below current levels is uneconomic for developers, which limits the downside on price per meter. Against that, the supply overhang above will restrain the pace of growth while the market absorbs delivered volumes. Support may come from major premium projects as they launch and re-rate their districts, and from Georgia's broader macro backdrop. But we will not turn this into a specific percentage: over a two to three-year horizon, one can responsibly speak of direction and drivers, not an exact number.
The practical takeaway is simple: build your plan on what is confirmed (the growth history and the 2026 forecast), not on promises about a distant future. The decision should rest on entry price, district, format, and your own holding horizon, not on the faith that the past pace will continue.
What this means for the buyer
First, timing. The market is neither at a euphoric peak nor in a slump but in a normalization phase, usually a more comfortable moment to enter than overheated growth, with less risk of overpaying. But a comfortable moment does not mean any property will do.
Second, the choice of district and type. When the market slows, the gap between a good and a poor choice becomes decisive. A location near growth drivers, a liquid format, and a vetted developer separate a property that holds and builds value from one that stalls. The price per meter by district, from 1,487 on the periphery to 3,028 in Old Batumi, is a starting budget frame, not a standalone criterion.
Third, the link to yield. Price is only the entry; what returns to you is rental income and potential resale. Price per meter alone is not enough; it must always be set against the district's realistic yield and format. We cover a detailed yield calculation with a worked example in our piece on Batumi rental income and the wider Georgian market in the overview of the 2026 market.
Our role is not to sell you any seaside studio, but to help you enter the right property for your goal and verify the numbers before the deal.
Find a property for your budget
Ready to move from a price overview to specifics? Get the "Georgia Investor Guide 2026" on WhatsApp with a full breakdown of figures and districts, or receive a shortlist of new-builds matched to your budget and goal. To discuss district choice and the numbers on a property straight away, book a free consultation.
This material is for reference only and is not investment, legal, or tax advice. Figures are given as of the publication date with their source and may change. Price forecasts are not guaranteed. Verify thresholds, taxes, and rules at the time of your transaction and consult a licensed lawyer and tax adviser in Georgia.
Ready to move from the overview to specifics?
Related reading
Frequently asked questions
How much is a square meter in Batumi in 2025?
The average new-build in finished, turnkey condition is about USD 1,865 per sqm for 2025, up 9.4% year on year (Galt and Taggart). The district spread is wide: from about USD 1,487 on the periphery to around USD 3,028 in Old Batumi.
Why do sources quote different prices per meter?
They use different samples. Around USD 1,865 is the new build (Galt and Taggart). Around USD 1,395 is the all-market average, including resale and unfinished units (TBC Capital, February 2026), which is why it is lower. When buying new-build, anchor to the turnkey primary series.
Will Batumi prices rise in 2026?
Galt and Taggart forecasts new-build growth slowing to about 4-6% for the year, down from 9.4% in 2025, with sales remaining broadly flat. Analysts call 2026 a year of consolidation. It is still growing, but more moderately.
What will prices do in 2027-2028?
There is no authoritative numeric forecast for that horizon, and precise figures two to three years out are conjecture. Construction costs limit the downside while the supply overhang restrains growth. Plan on confirmed data rather than a distant forecast.
How much have prices risen in recent years?
From 2022 to 2025, new-build prices in Batumi increased by roughly 40%, or about 12% per year (Galt and Taggart). This is history, not a promise of a repeat: the 2026 forecast is distinctly more modest.
Which district is the most and least expensive?
The most expensive is Old Batumi at about USD 3,028 per sqm; the most affordable by price per sqm is the periphery at about USD 1,487 (Galt and Taggart, end of 2025). Most transaction volume runs through New Boulevard and Heroes Alley.